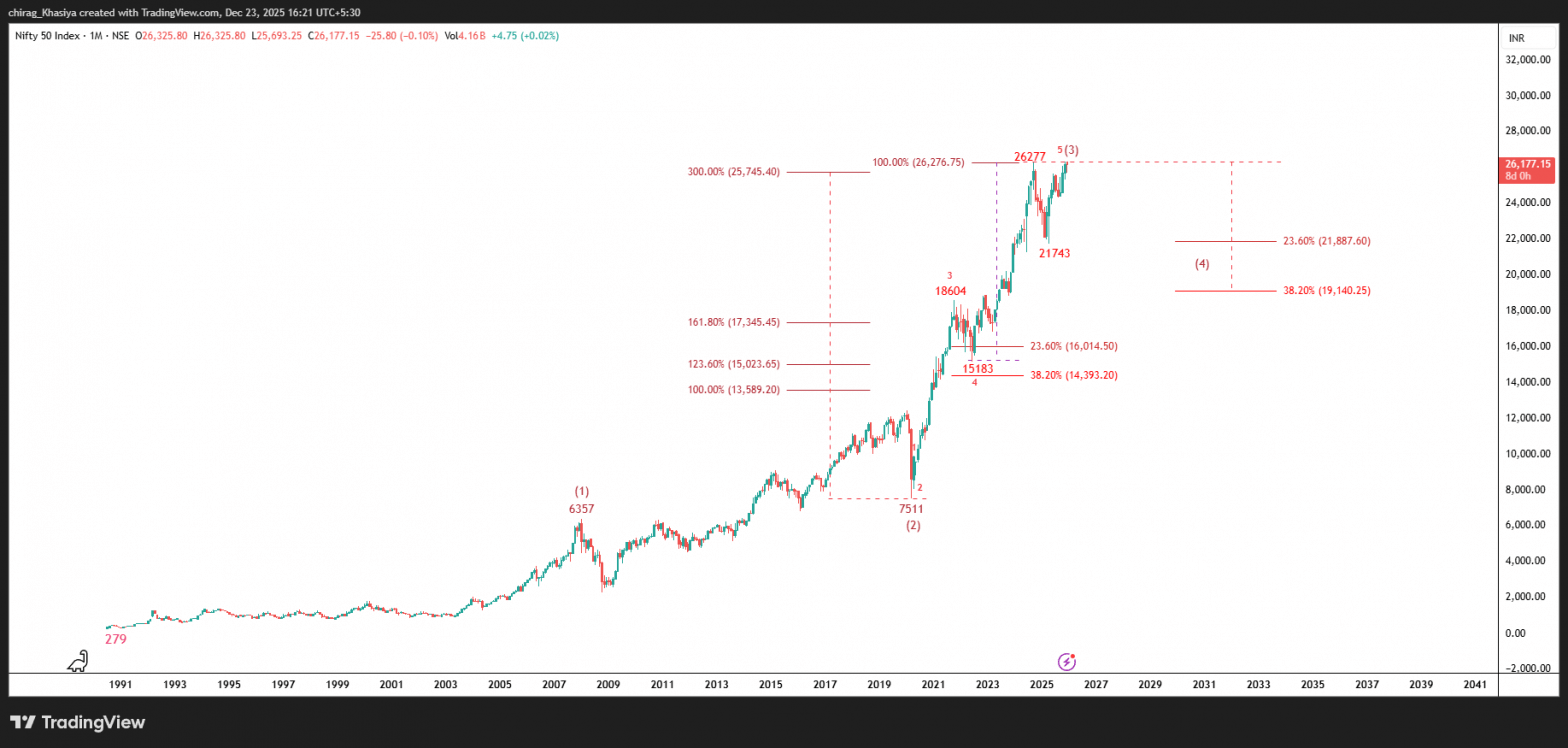
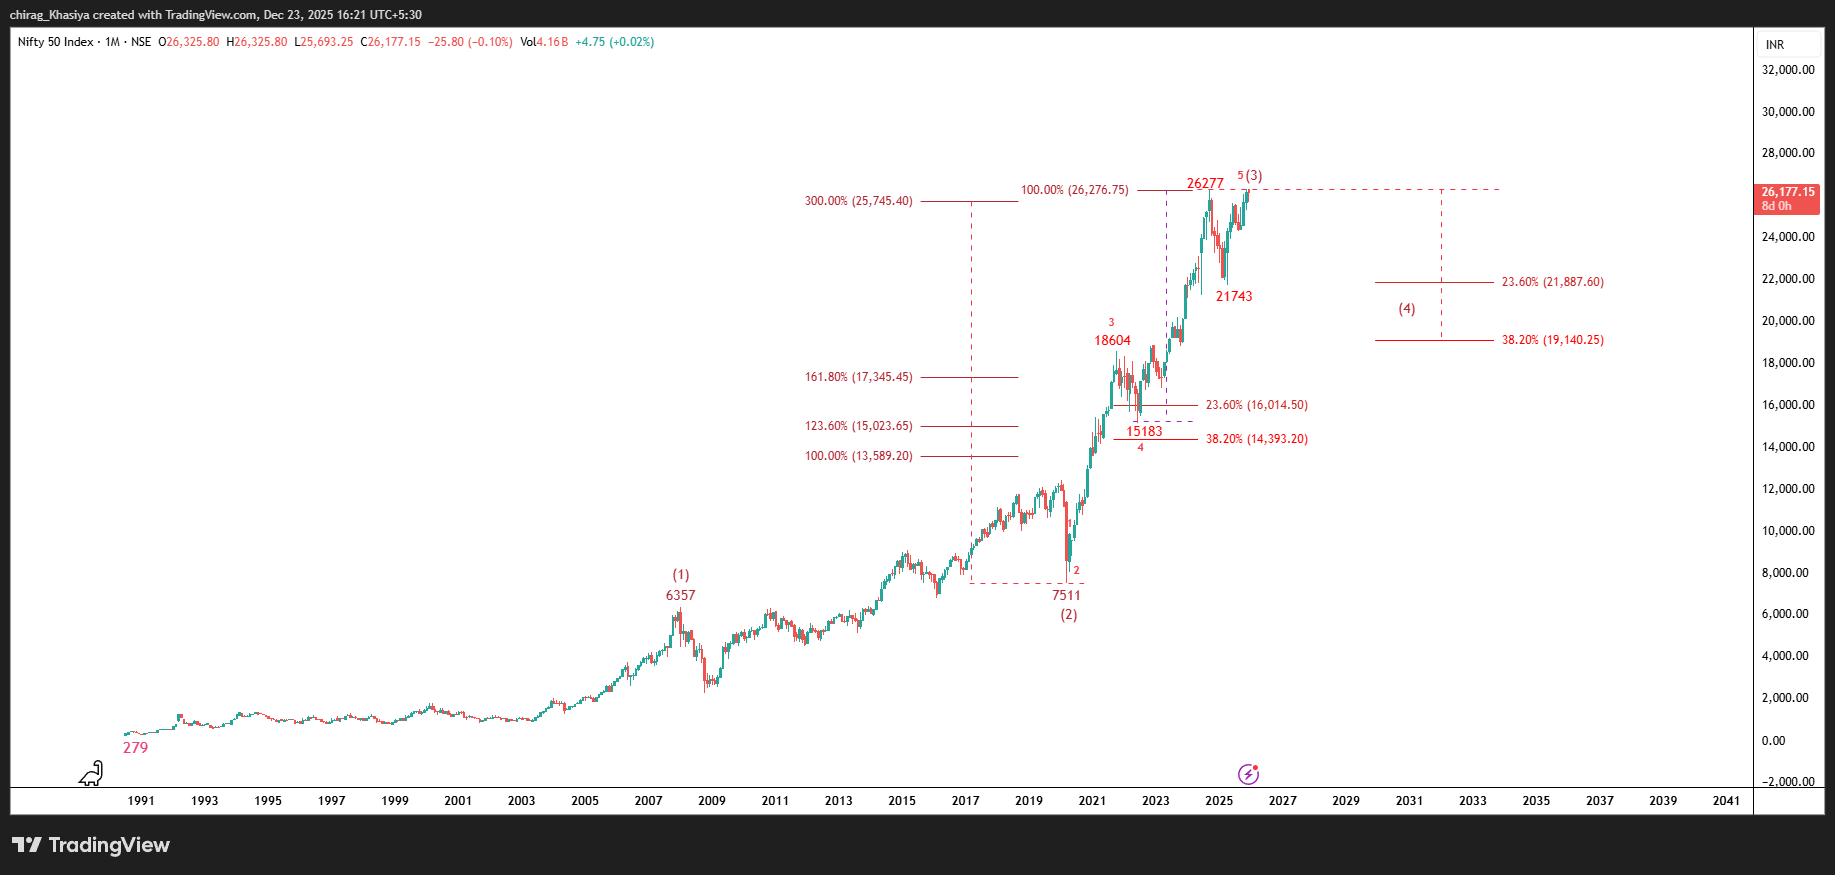
This is Monthly chart of Nifty and in which wave (1) and (2) is completed and wave (3) is near to its completion. May be last impulse started from 21743 is about to complete. After completion of wave (3) there may be a retracement of wave (4) which could be 23-38% of wave (3). If we calculate it from recent high then it is coming at roughly 21800-19100. So looking at the monthly chart of Nifty it looks like a scary picture to me. Lets see the last impulse started from 21743.
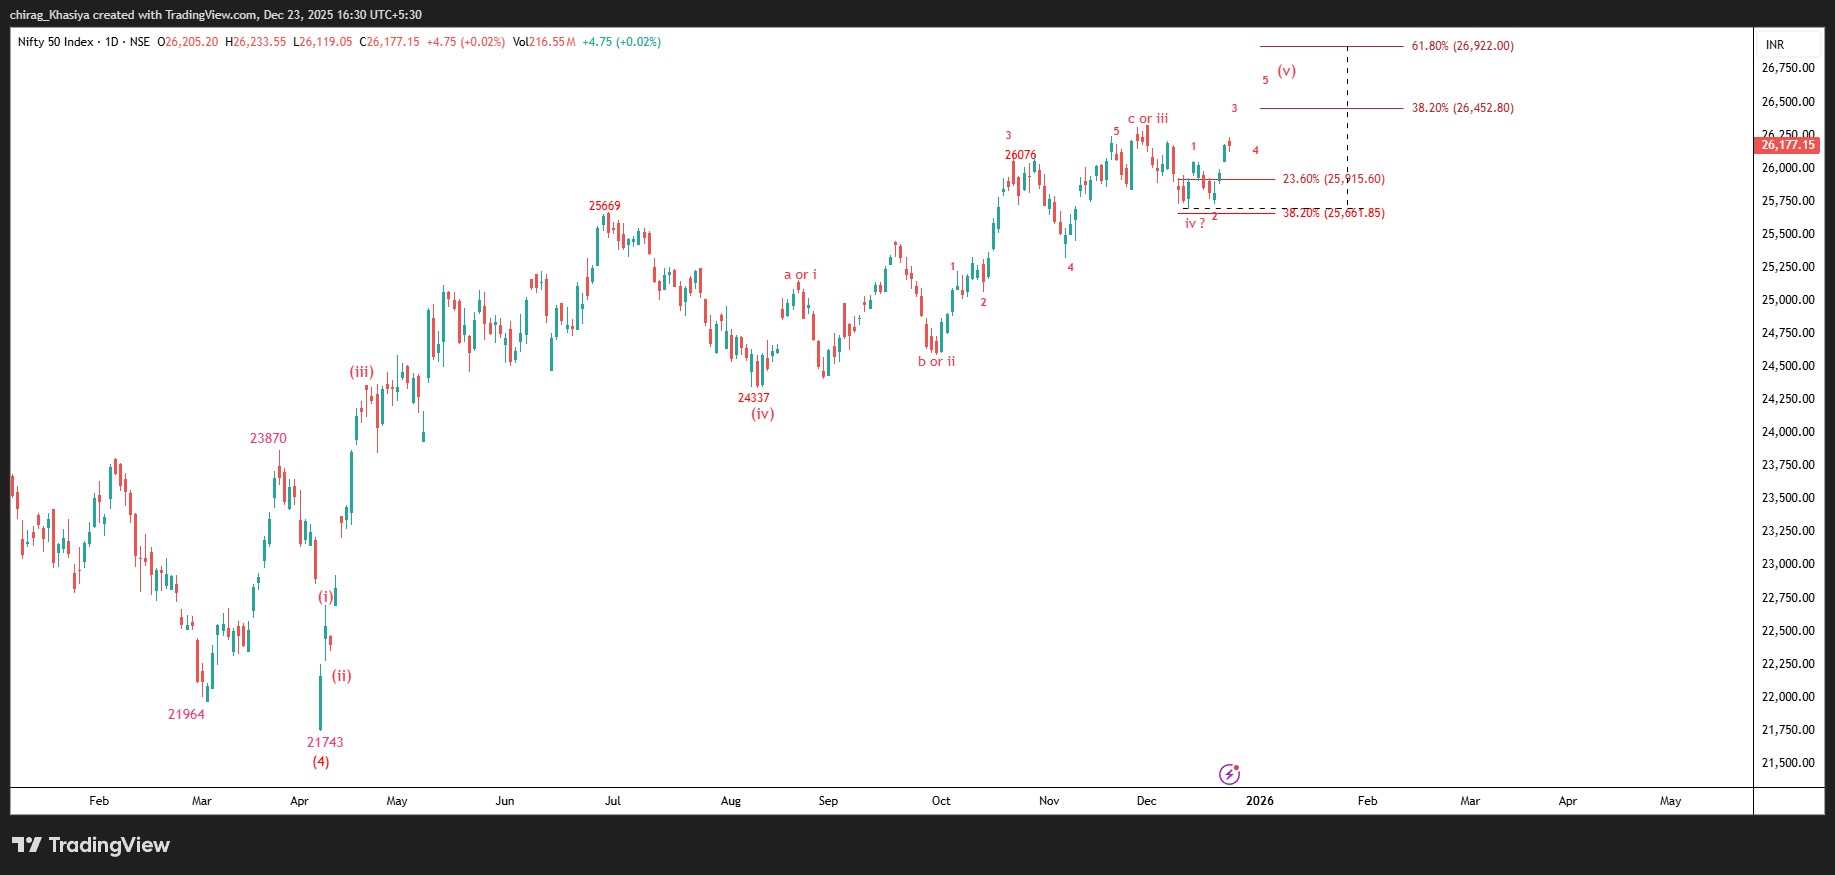
In this Daily chart started from 21743 bounce is so sharp that wave (i) and (ii) is very difficult to identify in this time frame. At the end of this sharp bounce we are considering wave (iii) end because from there the bounce looks slow and not clear like an impulse. Therefore we considered it as an irregular wave b of wave (iv). From 24337 wave (v) may be started and in that last impulse wave i, ii, iii and iv is completed and wave v is in progress. Completion range(26452-26922) of wave v is given in chart.
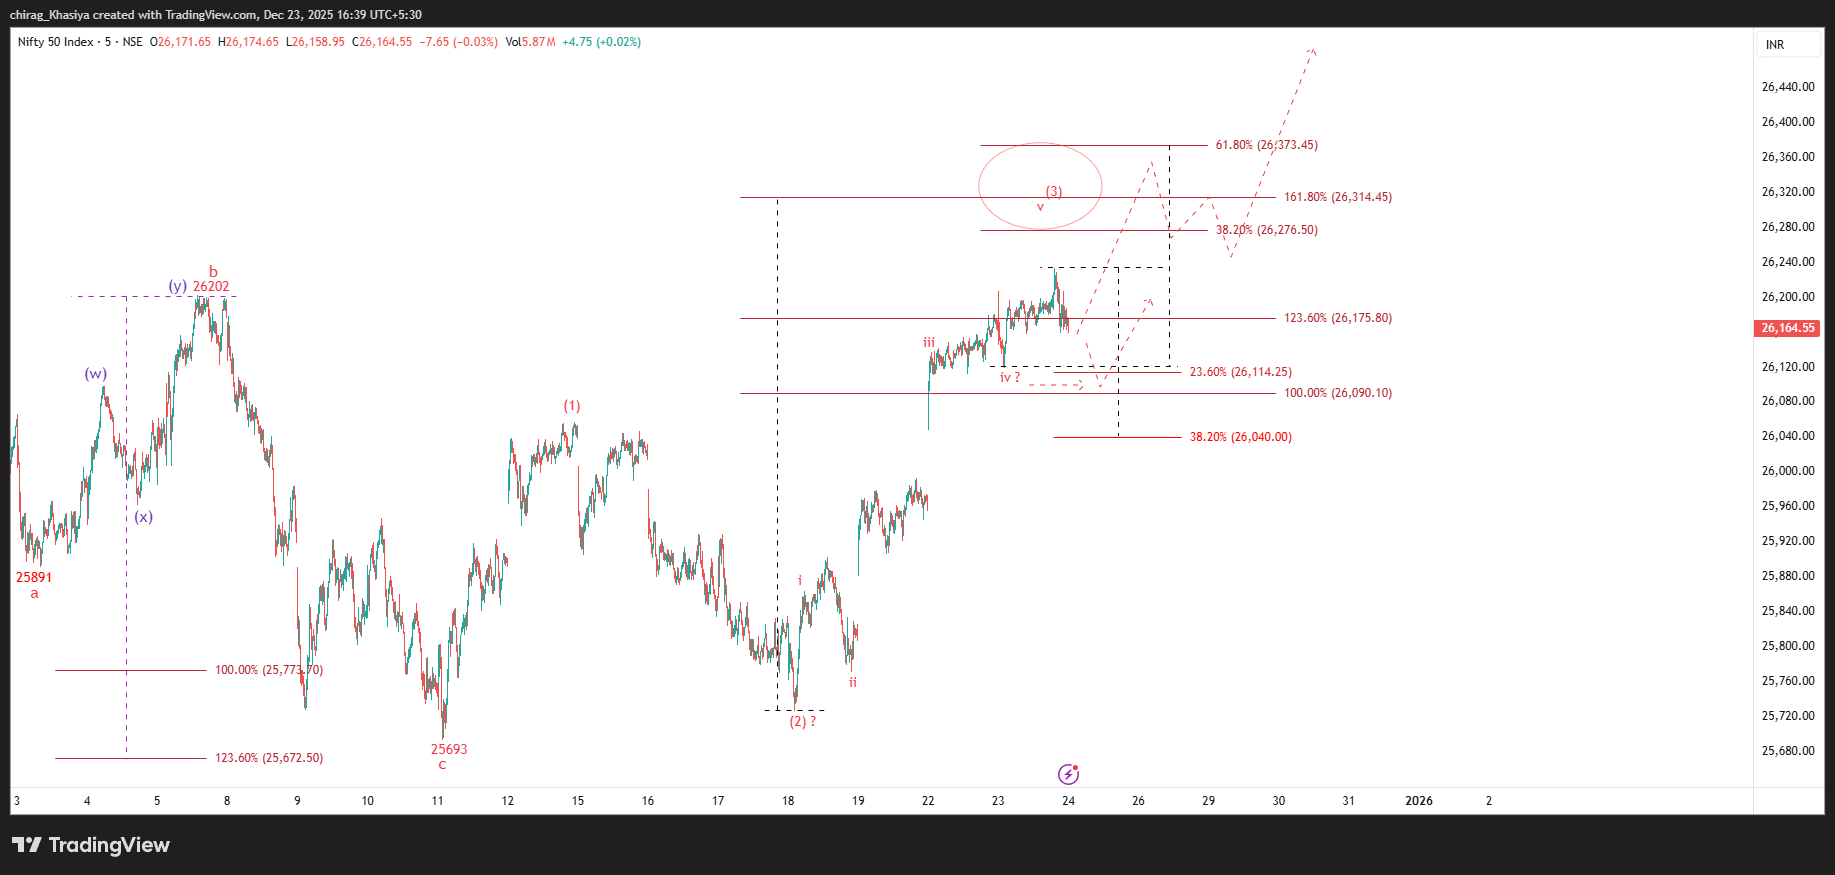
This is the 5min chart showing the last impulse started from 25693 which may complete in 26452-26922 range. As of now from 25693 wave (1) and (2) is completed and wave (3) is in progress. In wave (3) wave i, ii and iii is completed and wave iv is completed or still in progress.
26114-26040 support range for Nifty
26040 downside breakeven point. As long as Nifty is above 38% of wave (3), upside range 26452-26922 is possible.